Table of Contents >> Show >> Hide
- First, a reality check: there isn’t one universal percent-to-GPA conversion
- Way #1: Use your school’s official conversion chart (the “don’t argue with the transcript” method)
- Way #2: Convert percentage → letter grade → GPA points (the classic U.S. approach)
- Way #3: Convert each course to “quality points,” then calculate GPA (the accurate overall GPA method)
- Way #4: Use an application-specific conversion table (the “match what they expect” method)
- Way #5: Use an estimation model when no scale exists (the “best-available math” method)
- Common mistakes (so you don’t accidentally invent a GPA)
- A quick “choose your method” cheat sheet
- Extra experiences: what real students learn while converting percentages to a 4.0 GPA (and why it’s always a little awkward)
- Conclusion
You’ve got a percentagemaybe a shiny 92%, maybe a “we don’t talk about that 64%”and you need a
4.0 GPA equivalent. Easy, right? Not exactly. Converting percent to GPA is less like translating English
to Spanish and more like translating “pizza” to “the vibe of pizza.” There are rules… but they vary.
The good news: you can still get an accurate (or at least defensible) conversion by choosing the right
method for your situation. Below are five practical ways to convert a percentage into a 4.0 grade point
average, plus examples you can actually follow without needing a degree in Spreadsheet Sorcery.
First, a reality check: there isn’t one universal percent-to-GPA conversion
In the United States, schools and colleges often use percentage grades (0–100), letter grades (A–F),
and GPAs (usually 0.0–4.0), but the cutoffs for each letter grade can differ by district, high school,
department, professor, or institution. Some places treat a 90% as an A; others treat an A as 93–100.
Some include plus/minus grades (A-, B+), and others don’t. That’s why the “right” conversion depends on
which scale you’re trying to match.
Three questions to answer before you convert
-
Are you converting one class grade or an overall average?
A single class percentage converts to grade points. An overall GPA usually requires a credit-weighted calculation. -
Is the target GPA unweighted?
A 4.0 scale is typically unweighted (same maximum points for all classes). Weighted GPAs can exceed 4.0. -
Does the scale use plus/minus?
If yes, 89% might become a B+ instead of a plain B, and that changes the points.
Once you know those, pick the method that matches your goal: scholarship forms, college applications,
transfer credit evaluation, or just satisfying your curiosity at 1:00 a.m. (no judgment).
Way #1: Use your school’s official conversion chart (the “don’t argue with the transcript” method)
If you need a conversion for an application, scholarship, or official paperwork, this is the gold standard:
use the GPA scale published by your school, district, or the institution you’re applying to. Many schools
provide a transcript legend or a grading scale that directly maps percentages to grade points.
How to do it
- Find the grading scale on your transcript, student handbook, counseling page, or registrar site.
- Locate your percentage range (example: 90–92, 93–96, 97–100).
- Use the corresponding 4.0 scale value listed for that range.
Example
Let’s say your school’s chart maps:
90–92% = 3.7 and 93–100% = 4.0. If your grade is 92%,
your 4.0 equivalent is 3.7. If your grade is 94%, your 4.0 equivalent is
4.0. Simple, clean, and least likely to trigger an admissions office eye twitch.
This method is best when you need your conversion to align with how your school actually reports grades.
It’s also the best defense against the dreaded follow-up email: “Please explain how you calculated this.”
Way #2: Convert percentage → letter grade → GPA points (the classic U.S. approach)
When no official percent-to-GPA chart is available, the most common workaround is a two-step conversion:
first convert the percentage to a letter grade using a standard cutoff table, then convert the letter grade
into grade points on a 4.0 scale.
Step 1: Pick a percentage-to-letter scale
In the U.S., you’ll commonly see one of these patterns:
- Standard scale: A = 90–100, B = 80–89, C = 70–79, D = 60–69, F = 0–59
- Stricter scale (often with plus/minus): A = 93–96, A- = 90–92, B+ = 87–89, etc.
Step 2: Convert letter grade to grade points
A common 4.0 conversion (with plus/minus) looks like:
- A / A+ = 4.0
- A- = 3.7
- B+ = 3.3
- B = 3.0
- B- = 2.7
- …and so on down to F = 0.0
Example
Your final grade in Biology is 88%. Using a plus/minus scale, 88% often falls in the B+
range (commonly 87–89). A B+ typically equals 3.3 on a 4.0 scale. So: 88% ≈ 3.3 GPA.
This method is ideal when you’re converting a single class grade or building a rough GPA estimate and you
know which cutoff style is closest to your school’s grading culture.
Way #3: Convert each course to “quality points,” then calculate GPA (the accurate overall GPA method)
If you’re converting multiple percentages into an overall 4.0 GPA, don’t just average the GPA values
unless every course has identical weight. Many schools calculate GPA using quality points:
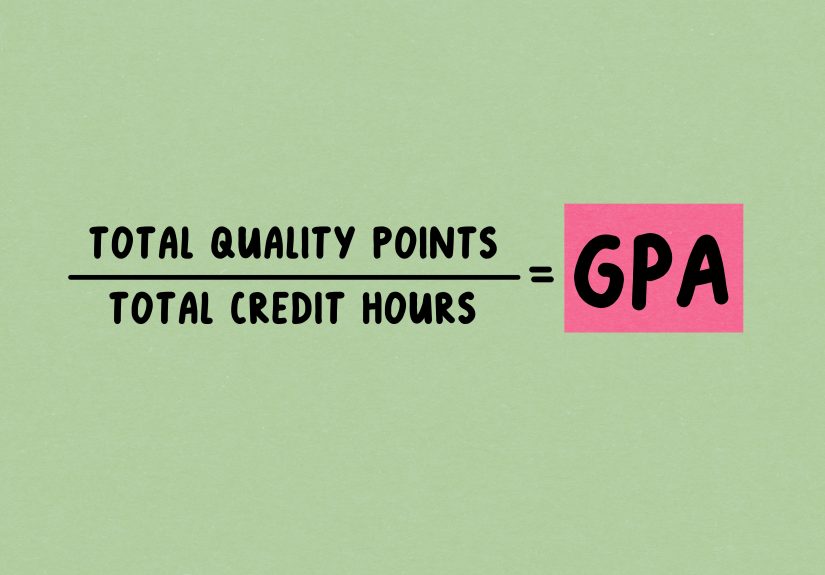
grade points multiplied by credit hours, then divided by total credits.
The formula
GPA = (Total Quality Points) ÷ (Total Credit Hours)
How to do it
- Convert each course percentage to grade points (using Way #1 or Way #2).
- Multiply grade points by the course credit hours to get quality points.
- Add all quality points together.
- Add all credit hours together.
- Divide total quality points by total credits.
Example (credit-weighted GPA)
Suppose you have:
- English (3 credits): 95% → A → 4.0 points → 4.0 × 3 = 12 quality points
- Algebra (4 credits): 88% → B+ → 3.3 points → 3.3 × 4 = 13.2 quality points
- History (3 credits): 82% → B- → 2.7 points → 2.7 × 3 = 8.1 quality points
Total quality points = 12 + 13.2 + 8.1 = 33.3
Total credits = 3 + 4 + 3 = 10
GPA = 33.3 ÷ 10 = 3.33
This method is the best choice when you’re calculating an overall GPA for reporting, comparing semesters,
or estimating eligibility for programs that care about a specific GPA cutoff.
Way #4: Use an application-specific conversion table (the “match what they expect” method)
Sometimes you’re not converting for your own schoolyou’re converting for someone else’s rules. Scholarship
committees, universities, and credential evaluation workflows can follow their own conversion practices.
In those cases, it’s smarter to use the conversion table provided by the application, the program, or the
receiving institution.
When this matters most
- Transfer applications: receiving schools may interpret grades using their policies.
- Graduate admissions: programs may standardize GPAs for comparison.
- International or cross-system applicants: conversions may be guided by credential evaluation norms.
- Special programs: honors colleges, scholarships, and competitive pipelines may specify a table.
How to do it
- Check the application instructions, FAQs, or admissions page for “GPA conversion” guidance.
- If they provide a chart, use iteven if it’s different from your school’s everyday scale.
- If they don’t provide a chart, use your official transcript legend (Way #1) or the letter-grade method (Way #2), and be consistent.
Think of this like cooking for someone else’s kitchen: you can be a great chef, but if they measure flour
in grams and you measure in cups, somebody’s cake is going to have a weird personality.
Way #5: Use an estimation model when no scale exists (the “best-available math” method)
Sometimes you have a percentage and zero context. No transcript legend. No school chart. No stated cutoffs.
Just vibesand a deadline. In that case, you can use a reasonable estimation model, as long as you label it
clearly as an estimate.
Option A: Use a common plus/minus mapping table
Choose a widely used percent-to-letter-to-points table (like one of the common 90–100 A ranges or stricter
93–100 A ranges), then convert. This usually produces a more realistic estimate than purely linear math.
Option B: Use a linear estimate (fast, simple, and not “official”)
A quick estimate some people use is:
Estimated GPA ≈ (Percentage ÷ 100) × 4.0
Example: 85% → 0.85 × 4.0 = 3.4
This is easy, but it can overestimate or underestimate depending on how strict the real cutoffs are.
Use it when you need a rough comparison, not when you’re filing an official form.
Option C: Use a “piecewise” estimate anchored to typical letter-grade bands
If you want more realism without pretending you have official cutoffs, anchor your conversion to common bands:
- 90–100 → ~4.0
- 80–89 → ~3.0
- 70–79 → ~2.0
- 60–69 → ~1.0
- <60 → 0.0
Then refine within bands using plus/minus if needed (e.g., 87–89 → ~3.3, 83–86 → ~3.0, 80–82 → ~2.7).
This mirrors how many U.S. systems think about grades, even when the exact boundaries differ.
When to use estimation
- Quick self-checks (“Am I roughly in the 3.5 neighborhood?”)
- Preliminary planning (scholarship searching, goal-setting)
- Early drafts of applications (until you confirm an official scale)
The key is honesty: if you estimated, say so. “Converted using a standard U.S. plus/minus scale” is clear
and reasonable. “This is definitely my official GPA” is… less clear, and less reasonable.
Common mistakes (so you don’t accidentally invent a GPA)
1) Averaging percentages and calling it a GPA
A 90% average does not automatically equal a 3.6, 3.7, or 4.0. You need a scale.
2) Ignoring course credits
A 4-credit class usually impacts your GPA more than a 1-credit class. If you’re calculating overall GPA,
use quality points (Way #3).
3) Mixing weighted and unweighted systems
If you’re converting to a 4.0 unweighted GPA, don’t add honors/AP weight unless the target
specifically asks for weighted GPA.
4) Assuming every school uses the same cutoffs
The difference between “A starts at 90” and “A starts at 93” can change your conversion meaningfully,
especially for grades near the boundary.
A quick “choose your method” cheat sheet
- You have your school’s scale: Use Way #1.
- You only have a percent and need a typical U.S. conversion: Use Way #2.
- You need an overall GPA from multiple classes: Use Way #3.
- You’re converting for a specific application/program: Use Way #4.
- You have no scale and need a reasonable estimate: Use Way #5.
Extra experiences: what real students learn while converting percentages to a 4.0 GPA (and why it’s always a little awkward)
To make this topic feel less like a math worksheet and more like real life, here are a few common experiences
students run into when converting a percentage into a 4.0 GPA. If any of these sound familiar, congratulations:
you’re not alone, and you’re definitely not the first person to whisper, “Wait… what scale are we using?” at
your laptop.
The scholarship application panic
A classic scene: a scholarship form asks for GPA on a 4.0 scale, but your report card shows only percentages.
You open five browser tabs, three calculators, and one forum thread from 2012 that confidently claims
“just divide by 25.” (Spoiler: that’s not a universal rule.) The lesson most students learn here is that
scholarships usually want a consistent conversion, not a magical one. Using your school’s transcript
legend or a standard percent-to-letter scale is typically the safest routeespecially because you can explain
it if asked.
The transfer student spreadsheet era
Transfer students often become accidental spreadsheet enthusiasts. When you’re juggling multiple courses,
different credit hours, and sometimes different grading styles between schools, the conversion becomes less
about one number and more about building an organized system. Many students discover that calculating quality
points (grade points × credits) feels “extra,” but it’s also the only way to get an overall GPA that matches
how registrars do it. The first time you see a 4-credit class swing your GPA more than a 1-credit elective,
it’s annoyingbut it also makes perfect sense.
The “my friend got a different GPA” mystery
Two students can have the same percentage and still convert it differently if they’re using different cutoff
charts. One school may treat 90–92 as an A-, while another treats 90–100 as an A. That can turn a 91% into a
3.7 in one system and a 4.0 in another. The big takeaway: a GPA is a summary of performance within a specific
grading framework. It’s not a universal constant like gravity. (Even gravity varies slightly, but that’s a
different article.)
The honors/AP confusion spiral
Students in honors, AP, IB, or dual enrollment courses often ask: “If I got an 88% in an AP class, is that
still a 3.3?” The honest answer is: it depends on whether you’re reporting weighted or unweighted GPA. Many
students learn to keep two numbers straight: an unweighted GPA for clean comparisons on a 4.0 scale, and a
weighted GPA that reflects course rigor. College admissions offices typically understand both, but application
forms may ask for one specifically. The experience here is mostly learning to read instructions carefully
because the form will not apologize if you choose chaos.
The international applicant “translation problem”
Students coming from different grading systems often face a bigger version of the same challenge: your score
might be a percentage, but the meaning behind that percentage can differ across systems. Some schools grade
more strictly; others have different distributions of scores; some use rankings or classifications. What students
often learn is that the best conversion is the one that matches what the receiving institution expects. That might
mean using a program’s conversion chart, an admissions guideline, or a standardized approach that focuses on
letter-grade equivalents and credit-weighted calculations rather than a single “one-size-fits-all” formula.
The confidence boost that comes from clarity
Here’s the surprisingly positive part: once you pick a method and apply it consistently, your stress drops fast.
You stop second-guessing every number and start focusing on what the GPA is actually forplanning, applying,
qualifying, and setting realistic goals. Converting a percentage to a 4.0 GPA isn’t just paperwork; it’s a way to
speak the academic “language” an application or school is using. And the moment you can explain your conversion in
one sentence (“Converted using my school’s transcript scale” or “Converted using a standard U.S. plus/minus table
and credit-weighted quality points”), you’ve basically won.