Table of Contents >> Show >> Hide
- Why Build a Tiny Wi-Fi Analyzer at All?
- What a Pocket Wi-Fi Analyzer Actually Measures
- The Best Hardware Recipe for a Pocket-Sized Analyzer
- A Practical Parts List
- How the Software Should Work
- How to Read the Results Like Someone Who Knows What They Are Doing
- Common Mistakes That Make DIY Wi-Fi Analyzers Less Useful
- Smart Upgrades That Make the Project Better
- Real-World Experiences with a Pocket Wi-Fi Analyzer
- Conclusion
- SEO Tags
If Wi-Fi feels like magic, that is because it kind of is. Your laptop connects, your phone streams, your smart bulb refuses to cooperate, and all of it happens through invisible radio waves bouncing around your home like caffeinated ping-pong balls. A pocket-sized Wi-Fi analyzer turns that invisible mess into something you can actually see. Instead of guessing why the kitchen has great internet but the bedroom feels like it runs on carrier pigeons, you can scan nearby networks, inspect channel congestion, compare signal strength, and make smarter decisions about router placement, access point setup, and troubleshooting.
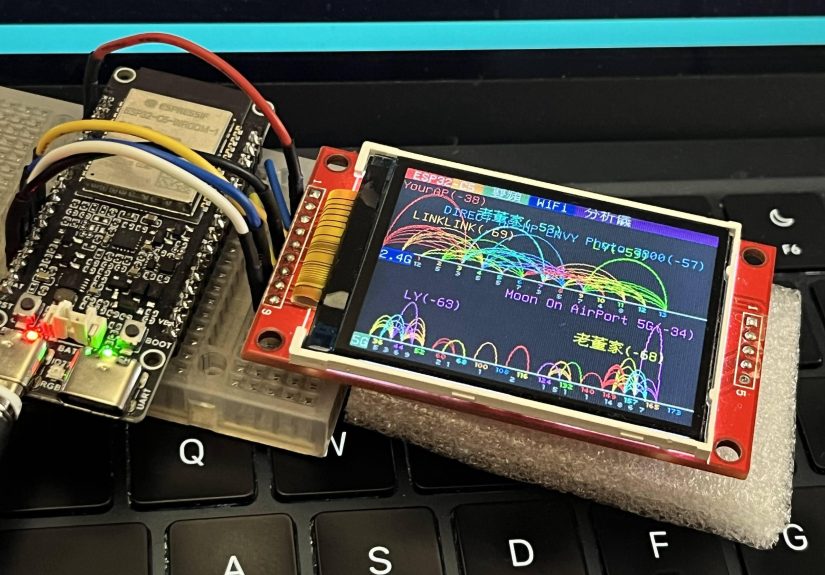
The fun part is that you no longer need a full laptop, a giant bench instrument, or an app-loaded sacrificial smartphone to do it. With today’s tiny microcontrollers, a small SPI display, a rechargeable battery, and a little code, you can build a handheld Wi-Fi analyzer that slips into a pocket and gives you a live view of nearby wireless activity. It is part networking tool, part electronics project, and part “look what I made” flex.
Even better, this is not science fiction or garage mythology. Recent DIY builds have shown that an ESP32-C5 paired with a compact display can create a genuinely useful dual-band Wi-Fi analyzer for 2.4 GHz and 5 GHz environments. That means you can make something small, affordable, and surprisingly practical without needing a shopping cart full of lab-grade gear. The result is a device that helps you understand wireless congestion, spot overlapping channels, and diagnose weak coverage before you start blaming your router, your ISP, or the moon.
Why Build a Tiny Wi-Fi Analyzer at All?
Because wireless problems are sneaky. Slow speed is not always caused by weak signal. A network can show “full bars” and still perform badly if the channel is crowded, interference is high, or your device is camping on the wrong band. That is where a handheld analyzer earns its keep. It gives you quick visibility into nearby SSIDs, channel usage, signal strength, and band activity in a way that feels immediate and practical.
There is also a real convenience factor. Phone apps are handy, but they are not always ideal for continuous monitoring, field testing, or dedicated troubleshooting. A purpose-built analyzer boots fast, lives in your tool bag, and does one job well. No notifications, no random social media detour, no incoming call ruining your network survey. Just scan, inspect, and move on with your day like the wireless gremlin hunter you were always meant to be.
What a Pocket Wi-Fi Analyzer Actually Measures
SSID, Channel, and Signal Strength
At the most basic level, your analyzer scans for nearby access points and collects information such as SSID, channel number, RSSI, and security type. RSSI, or received signal strength indicator, is often the first number people obsess over, and for good reason: it helps you understand how strong a signal appears at your current location. Stronger signal often supports better performance, although signal strength alone does not tell the whole story.
That last point matters. A strong signal can still deliver mediocre Wi-Fi if the channel is crowded or the noise floor is ugly. That is why better analyzers also visualize channel occupancy and make it easier to see whether multiple routers are stomping on one another. Think of it less like checking the volume of one singer and more like checking whether the whole choir is screaming into the same microphone.
2.4 GHz vs. 5 GHz vs. “Maybe Someday 6 GHz”
If you are building around an ESP32-C5, the sweet spot is dual-band scanning on 2.4 GHz and 5 GHz. That is a big step up from older ESP8266-based builds, which are limited to 2.4 GHz. In real homes and offices, dual-band visibility is a genuine advantage because 2.4 GHz is crowded and long-reaching, while 5 GHz usually offers more room and better performance at shorter range.
That difference is not just folklore. The 2.4 GHz band is narrow and typically limited to three non-overlapping 20 MHz channels in the United States, which is why it gets congested so easily. The 5 GHz band is much roomier, which is one reason it often performs better when you are close enough to the access point. The 6 GHz band is larger still, but most tiny DIY analyzers are not targeting full 6 GHz support yet, so for a pocket project, dual-band 2.4/5 GHz is the practical goal.
The Best Hardware Recipe for a Pocket-Sized Analyzer
1. Pick the Right Brain
The most interesting option right now is the ESP32-C5. It gives you onboard dual-band Wi-Fi hardware, which makes it well-suited for a compact analyzer that can see both 2.4 GHz and 5 GHz activity. That alone makes it more capable than older 2.4 GHz-only designs and much more useful in modern homes where 5 GHz carries the performance load.
If you already have an ESP32-S2, ESP32-S3, or ESP8266 board, you can still build a useful analyzer, but expect a more limited role. Those versions are great for learning, great for cheap builds, and great for basic 2.4 GHz scanning. They are just not the same thing as a dual-band scout. Use them if your goal is “build a neat gadget this weekend.” Reach for the C5 if your goal is “build something I will actually keep using.”
2. Add a Small TFT Display
A tiny TFT screen is what transforms this project from “serial monitor experiment” into an honest-to-goodness handheld tool. Many successful builds use compact SPI displays driven by controllers such as the ILI9341, ST7735, or ST7789. A 1.8-inch to 2.4-inch display usually feels like the sweet spot: large enough for graphs and channel bars, small enough to stay genuinely pocketable.
Color matters here. A monochrome OLED can show text, but a TFT makes it much easier to plot channels, signal bars, and menu states without squinting like you are deciphering a treasure map. Libraries in the Arduino ecosystem make drawing text, boxes, lines, and charts relatively painless, so your UI can be clear without becoming a semester-long graphics project.
3. Make It Portable with a LiPo Battery
If it has to stay tethered to USB, it is technically portable in the same way a goldfish is technically athletic. A single-cell LiPo battery makes the analyzer truly useful. Many compact ESP32 boards support USB charging, battery monitoring, and fuel-gauge features, which makes battery integration less painful than it used to be.
Battery power is not just about convenience. It also changes how you use the device. You can walk room to room, test dead zones, compare upstairs and downstairs performance, and run a quick channel scan from wherever your Wi-Fi is acting suspicious. Just make sure your power setup is solid. Weak cables, drained batteries, or sketchy power delivery can cause ESP32 boards to brown out during Wi-Fi activity, which is a very rude way for your analyzer to take a nap.
4. Use Buttons and a Simple Enclosure
Three buttons are enough for a surprisingly polished interface: one for band or screen selection, one for scrolling, and one for refreshing or entering a details view. Add a small 3D-printed case, and suddenly your project stops looking like “temporary breadboard experiment number 47” and starts looking like a real field tool.
You do not need a fancy enclosure on day one. Even a laser-cut sandwich case or printed shell with cutouts for USB-C, the display, and buttons will make the device more durable and more pleasant to use. The first time you toss it in a bag and pull it out intact, you will thank past-you for doing the extra hour of mechanical work.
A Practical Parts List
- ESP32-C5 development board for dual-band Wi-Fi scanning
- Small SPI TFT display such as ILI9341, ST7735, or ST7789
- 3.7V LiPo battery
- Battery-capable board or onboard charging circuit
- Two or three tactile buttons
- Jumper wires or compact soldered connections
- Optional microSD card for logging scan results
- Optional 3D-printed enclosure
How the Software Should Work
Scan, Sort, and Visualize
The software loop is simple in concept. Trigger a Wi-Fi scan, gather the list of visible networks, extract the important fields, sort or group them, and draw the results on the screen. That can mean listing the strongest networks, showing channels as bar graphs, separating 2.4 GHz and 5 GHz views, or highlighting crowded frequencies.
The best user interfaces do not just dump raw data. They help you answer questions fast. Which channel is crowded? Which access point is strongest here? Is 2.4 GHz unusable in this room? Did my router really pick channel 3 like it woke up and chose chaos? A good analyzer makes those answers obvious at a glance.
Show the Right Metrics
For a useful first version, display the SSID, channel number, RSSI, and band. For a better version, add a channel graph that stacks visible networks on the same frequency range, color-codes bands, and lets you sort by signal strength. If your board supports battery monitoring, show battery percentage or voltage in a corner so the device does not die mid-survey and leave you staring at a blank rectangle of regret.
You can also add a simple peak-hold or averaging mode so the numbers do not jump around like a squirrel on espresso. Raw scan data tends to fluctuate. A little smoothing makes the tool more readable and more professional.
How to Read the Results Like Someone Who Knows What They Are Doing
Start with 2.4 GHz. In the United States, channels 1, 6, and 11 are the classic non-overlapping choices, and that rule still matters. If your analyzer shows several nearby routers smeared across overlapping channels, you have probably found the wireless equivalent of too many people trying to park in one space. That congestion can hurt stability and throughput even if the signals look strong.
Next, pay attention to channel width. On 2.4 GHz, keeping things at 20 MHz is usually the sane choice because it reduces interference. On 5 GHz, 40 MHz can be a practical balance between speed and stability for many setups. Your analyzer will not magically fix the network for you, but it will show you whether the radio environment looks civilized or like an RF food fight.
Finally, remember that signal strength is not the same thing as speed. Stronger signal often helps, but the real-world experience also depends on interference, channel reuse, noise, and how the client adapts its data rate. That is why advanced network folks care about SNR and not just raw RSSI. In a healthy setup, strong signal plus decent SNR is a much better story than strong signal alone.
Common Mistakes That Make DIY Wi-Fi Analyzers Less Useful
Tiny Screen, Giant Ambition
Trying to cram every possible metric onto a tiny display is a classic mistake. If your interface looks like a spreadsheet lost a fight with a smartwatch, simplify it. Show fewer networks. Use pages. Prioritize channel visualization and the strongest results first.
Ignoring Antenna Reality
Some compact dev boards have modest onboard antennas, and that affects what your analyzer sees. If the antenna is weak, your readings may underrepresent distant networks. That does not make the tool useless, but it does mean you should think of it as a local survey instrument, not an all-seeing radio oracle.
Bad Power Design
Wi-Fi activity pulls current in bursts. If your battery is tired, your cable is flimsy, or your regulator is unhappy, the board may reset or behave erratically. Good power delivery is not glamorous, but it is the difference between a dependable tool and a pocket-sized drama machine.
Expecting a Lab Spectrum Analyzer
This project is a Wi-Fi analyzer, not a full RF spectrum analyzer. It is excellent for seeing Wi-Fi networks, channel congestion, and signal conditions relevant to normal troubleshooting. It is not meant to replace professional gear for deep RF analysis across every possible emitter in your environment. Know what it is, and it becomes extremely useful. Expect it to do everything, and disappointment will arrive right on schedule.
Smart Upgrades That Make the Project Better
- Add logging to microSD so you can compare locations later
- Build a heat-mapping mode by recording signal level room by room
- Add a details screen for one selected SSID
- Show battery voltage and state of charge
- Include a screen brightness setting to save power
- Create a simple web export mode over USB or serial
- Add a vibration or icon alert when a chosen channel becomes crowded
Real-World Experiences with a Pocket Wi-Fi Analyzer
The most surprising thing about carrying a pocket-sized Wi-Fi analyzer is how quickly it changes your instincts. Before using one, many people troubleshoot Wi-Fi by superstition. They reboot the router, move it three inches to the left, glare at the modem, and hope the internet gods accept the offering. After using a dedicated analyzer, you start noticing patterns instead of guessing. You walk into a room and immediately wonder what the 2.4 GHz band looks like there, whether the 5 GHz signal drops near the hallway corner, or whether the neighbor’s router is camping on the same channel again.
In a typical home, the first scan is usually hilarious and humbling. You expect to see your network and maybe one or two neighbors. Instead, the display lights up like a holiday parade. Suddenly there are a dozen SSIDs with names ranging from perfectly normal to mildly concerning. You realize your apartment building is not a peaceful wireless meadow. It is a crowded radio apartment complex where every router is yelling through the walls. That moment alone makes the project worth building, because it turns an abstract problem into something visible and obvious.
There is also a strange satisfaction in walking room to room and watching the numbers change. Near the router, the signal looks great and the analyzer feels almost boring. Then you move behind a concrete wall, near a kitchen appliance, or to the far bedroom where streaming always stutters, and the story changes. Maybe the signal drops sharply. Maybe the channel graph reveals that your “dead zone” is actually a “busy zone.” Maybe the 2.4 GHz band is packed while 5 GHz is still usable. You stop making assumptions and start making decisions.
People who build one also tend to discover how messy “automatic” router settings can be. Auto channel selection sounds smart until your analyzer reveals that the router picked a less-than-ideal channel or is using settings that make sense on paper but not in your building. That does not mean auto is always bad. It means real environments are messy, and a little visibility goes a long way. The analyzer becomes the device that settles arguments between what the settings page claims and what the room is actually experiencing.
Another real-world lesson is that a dedicated handheld tool changes behavior because it is frictionless. Pulling out a phone app feels temporary. Pulling out a small custom analyzer feels intentional. You use it more often. You test more locations. You notice battery life, boot time, interface clarity, and whether the buttons make sense. In other words, the project teaches electronics and networking, but it also teaches product design. The best version is not the one with the most features. It is the one you actually enjoy using.
And yes, there is a little joy in the theatrical side of it. A tiny device with a color display that scans the invisible world around you is just cool. It makes networking feel tactile. It turns Wi-Fi from a background utility into something you can inspect, compare, and understand. That is the magic of a project like this: it is useful enough to solve real problems, simple enough to build over a weekend, and nerdy enough to make you grin every time it reveals why the living room works perfectly while the guest room behaves like it is connecting through a potato.
Conclusion
Building a pocket-sized Wi-Fi analyzer is one of those rare projects that checks all the right boxes. It is compact, practical, educational, and just plain fun. You learn about RF behavior, channel planning, power design, interface layout, and portable hardware all at once. More importantly, you end up with a tool you will actually use, whether you are optimizing your home network, testing access point placement, or satisfying your curiosity about what the wireless world around you is doing.
If you want the best balance of usefulness and simplicity, start with an ESP32-C5, a small TFT display, a LiPo battery, and a clean channel-graph interface. Keep the first version focused. Make it readable. Make it dependable. Then add the fancy stuff later. That approach will get you from loose parts to working gadget much faster, and it will leave you with something better than a novelty: a pocket-sized Wi-Fi analyzer that earns its spot in your bag.